


Key findings:
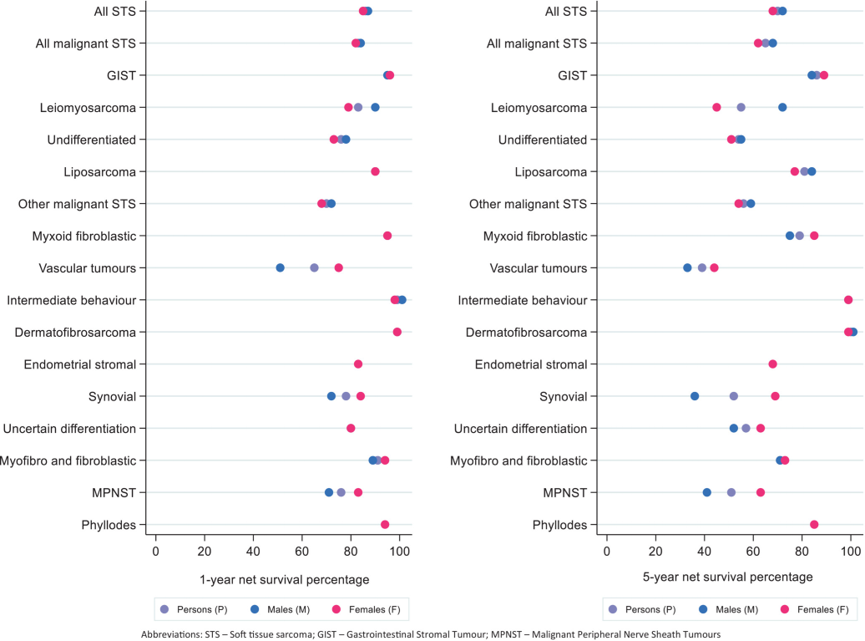
- Net survival for all soft tissue sarcomas was 85.8% at 1-year and 70.2% at 5-years.
- For those coded as malignant (excluding intermediate behaviour), survival was 83.1% at 1-year and 65% at 5-years.
- Vascular tumours have the poorest outcome with a 5-year survival of 39%.
- Patients diagnosed with GIST have a 5-year survival of 86%.
- The 5-year net survival is slightly higher in males (68% vs 62%). This is due to a higher incidence of subtypes which are linked to poorer outcomes.
It’s worth noting that for some of the more rare subtypes of soft tissue sarcoma, the numbers were too low to calculate accurate survival statistics.
You can explore more of the findings in the figure and table below, or access the full paper here.
Figure 1: One- and five-year net survival according to morphological subtype and gender, for patients diagnosed between 2013 and 2017
Bacon, A., Wong, K., Fernando, M.S., Rous, B., Hill, R.J., Collins, S.D., Broggio, J. and Strauss, S.J., 2023. Incidence and survival of soft tissue sarcoma in England between 2013 and 2017, an analysis from the National Cancer Registration and Analysis Service. International Journal of Cancer, 152(9), pp.1789-1803.
Table 1: One- and five-year net survival according to morphological subtype and gender, for patients diagnosed between 2013 and 2017
| Tumour Type | N | 1-year net survival | LCI | UCI | 5-year net survival | LCI | UCI |
|---|---|---|---|---|---|---|---|
| Gastrointestinal stromal tumour | |||||||
| Gastrointestinal stromal tumours (intermediate behaviour) | 2746 | 0.97 | 0.96 | 0.98 | 0.92 | 0.89 | 0.95 |
| Gastrointestinal stromal tumours (malignant) | 1173 | 0.93 | 0.91 | 0.95 | 0.75 | 0.69 | 0.8 |
| Leiomyosarcoma | |||||||
| Epithelioid leiomyosarcoma | 59 | 0.83 | 0.7 | 0.91 | – | – | – |
| Leiomyosarcoma, NOS | 2507 | 0.83 | 0.81 | 0.85 | 0.56 | 0.52 | 0.59 |
| Undifferentiated sarcoma | |||||||
| Undifferentiated pleomorphic sarcoma | 1094 | 0.82 | 0.8 | 0.85 | 0.58 | 0.52 | 0.65 |
| Fibrous histiocytoma malignant | 227 | 0.84 | 0.78 | 0.89 | 0.71 | 0.61 | 0.79 |
| Spindle cell sarcoma | 851 | 0.75 | 0.71 | 0.78 | 0.5 | 0.44 | 0.56 |
| Undifferentiated sarcoma | 276 | 0.59 | 0.53 | 0.65 | 0.44 | 0.36 | 0.53 |
| Liposarcoma | |||||||
| Dedifferentiated liposarcoma | 528 | 0.8 | 0.76 | 0.83 | 0.66 | 0.58 | 0.73 |
| Liposarcoma, NOS; fibroliposarcoma | 565 | 0.9 | 0.87 | 0.93 | 0.84 | 0.8 | 0.88 |
| Liposarcoma well differentiated | 544 | 0.99 | 0.97 | 1 | 0.96 | 0.92 | 0.99 |
| Myxoid liposarcoma myxoliposarcoma | 357 | 0.97 | 0.94 | 0.98 | 0.9 | 0.84 | 0.95 |
| Pleomorphic liposarcoma | 230 | 0.85 | 0.79 | 0.89 | 0.56 | 0.44 | 0.67 |
| Other malignant soft tissue tumours | |||||||
| Adenosarcoma | 225 | 0.88 | 0.82 | 0.92 | 0.77 | 0.68 | 0.85 |
| Chondrosarcoma | 114 | 0.9 | 0.82 | 0.95 | 0.79 | 0.66 | 0.89 |
| Osteosarcoma, NOS | 46 | 0.62 | 0.46 | 0.75 | – | – | – |
| Sarcoma, NOS | 1367 | 0.64 | 0.61 | 0.66 | 0.51 | 0.47 | 0.55 |
| Myxoid and other fibroblastic tumours | |||||||
| Low-grade fibromyxoid sarcoma | 75 | 0.92 | 0.81 | 0.97 | 0.83 | 0.64 | 0.94 |
| Myxofibrosarcoma | 875 | 0.95 | 0.93 | 0.96 | 0.79 | 0.73 | 0.85 |
| Soft tissue tumours of intermediate behaviour | |||||||
| Abdominal fibromatosis | 137 | 0.94 | 0.88 | 0.98 | 0.89 | 0.78 | 0.95 |
| Atypical lipomatous tumours | 512 | 1 | 0.98 | 1.01 | 1 | 0.94 | 1.03 |
| Giant cell tumour of soft parts | 114 | 1.01 | 1.01 | 1.01 | 1.04 | 0.92 | 1.05 |
| Glomangiomatosis pericytic tumours | 12 | 1.01 | 1.01 | 1.01 | – | – | – |
| Haemangioendothelioma, NOS | 17 | 1.01 | 1.01 | 1.01 | – | – | – |
| Vascular tumours | |||||||
| Angiomyosarcoma | 38 | 0.69 | 0.5 | 0.82 | – | – | – |
| Epithelioid haemangioendothelioma malignant | 67 | 0.84 | 0.72 | 0.92 | 0.77 | 0.62 | 0.87 |
| Haemangiosarcoma angiosarcoma of soft tissue | 800 | 0.62 | 0.58 | 0.65 | 0.32 | 0.27 | 0.37 |
| Dermatofibrosarcoma protuberans | |||||||
| Fibrosarcomatous dermatofibrosarcoma protuberans | 704 | 0.99 | 0.97 | 1 | 1 | 0.97 | 1.03 |
| Tumours of uncertain differentiation | |||||||
| Clear cell sarcoma except of kidney m89643 | 35 | 0.88 | 0.71 | 0.96 | – | – | – |
| Desmoplastic small round cell tumour | 48 | 0.45 | 0.31 | 0.59 | – | – | – |
| Epithelioid sarcoma | 92 | 0.7 | 0.58 | 0.79 | 0.45 | 0.3 | 0.6 |
| Myoepithelial carcinoma | 64 | 0.92 | 0.81 | 0.98 | – | – | – |
| Myxoid chondrosarcoma | 68 | 0.96 | 0.86 | 1 | 1.01 | 0.9 | 1.06 |
| Synovial | |||||||
| Synovial sarcoma biphasic | 47 | 0.73 | 0.56 | 0.85 | – | – | – |
| Synovial sarcoma, NOS | 263 | 0.77 | 0.71 | 0.82 | 0.49 | 0.38 | 0.59 |
| Synovial sarcoma spindle cell | 63 | 0.77 | 0.63 | 0.86 | 0.51 | 0.35 | 0.65 |
| Endometrial stromal tumour | |||||||
| Endometrial stromal sarcoma | 238 | 0.77 | 0.7 | 0.82 | 0.57 | 0.48 | 0.64 |
| Endometrial stromal sarcoma, low grade | 151 | 0.98 | 0.93 | 1 | 0.93 | 0.82 | 0.99 |
| Myofibrosarcomas and other fibroblastic sarcomas | |||||||
| Fibrosarcoma, NOS | 54 | 0.92 | 0.8 | 0.97 | – | – | – |
| Inflammatory myofibroblastic tumour | 72 | 0.9 | 0.79 | 0.96 | 0.81 | 0.66 | 0.9 |
| Malignant tenosynovial giant cell tumour | 18 | 1.01 | 1.01 | 1.01 | 1.03 | 1.03 | 1.03 |
| Solitary fibrous tumour, NOS | 188 | 0.9 | 0.84 | 0.94 | 0.63 | 0.48 | 0.76 |
| Malignant peripheral nerve sheath tumour | |||||||
| Malignant peripheral nerve sheath tumour, NOS | 236 | 0.74 | 0.68 | 0.8 | 0.4 | 0.27 | 0.54 |
| Malignant schwannoma neurilemoma malignant | 54 | 0.9 | 0.78 | 0.96 | 0.85 | 0.68 | 0.94 |
1 and 5-year net survival for patients diagnosed between 2013 and 2017 by morphological subtype.
Net survival is estimated survival based only on deaths from the sarcoma in question and removes that from other causes (background mortality).
Net survival shown as a percentage of patients surviving to 1 and 5 years post diagnosis. This can be expressed as greater than 100% due to modifying behaviour after diagnosis which increases survival beyond expected.
Abbreviations: N – cohort size; LCI – Lower Confidence Interval; UCI – Upper Confidence Interval. Patients aged between 0-14 were excluded from analysis


