
Key findings:
-
- Importantly, this analysis demonstrates social deprivation impacts survival. Soft tissue sarcoma patients living in the most deprived quintile were 22% more likely to die within 5 years, compared to those in the least deprived areas.
- Cases were more commonly reported in affluent areas, with the least deprived quintile accounting for 22% of cases compared to 16% in the most deprived quintile.
- There was an increasing likelihood for patients to present through an emergency route as deprivation increases.
- Cases of soft tissue sarcoma were less common in more deprived areas for male patients.
It is possible that patients from more deprived areas have poorer access to specialist sarcoma services, which has been demonstrated to impact outcome in STS¹.
You can explore more of the findings in the table and figures below, or access the full paper here.
Table 1: Sarcoma deprivation, crude and aged standardised (European) 5-year incidence rates per 1,000,000 (95% confidence interval), 2013-2017.
| Sex | Deprivation | Tumour count | Crude | Age standardised* | LCI | UCI |
|---|---|---|---|---|---|---|
| Males | 1 – Least deprived | 2308 | 87 | 88.8 | 85.1 | 92.5 |
| 2 | 2292 | 85.1 | 87.1 | 83.6 | 90.8 | |
| 3 | 2064 | 75.1 | 84.2 | 80.5 | 87.9 | |
| 4 | 1777 | 65.5 | 81.7 | 77.8 | 85.6 | |
| 5 – Most deprived | 1606 | 59.5 | 80.2 | 76.1 | 84.3 | |
| Females | 1 – Least deprived | 1992 | 73.5 | 69.8 | 66.7 | 72.9 |
| 2 | 2049 | 73.8 | 69.3 | 66.3 | 72.4 | |
| 3 | 2001 | 70.9 | 71.3 | 68.2 | 74.5 | |
| 4 | 1887 | 67.9 | 74.3 | 71 | 77.8 | |
| 5 – Most deprived | 1741 | 62.5 | 75 | 71.5 | 78.7 | |
| Persons | 1 – Least deprived | 4300 | 80.2 | 79.3 | 76.9 | 81.7 |
| 2 | 4341 | 79.4 | 78.2 | 75.9 | 80.6 | |
| 3 | 4065 | 72.9 | 77.7 | 75.3 | 80.2 | |
| 4 | 3664 | 66.7 | 78 | 75.4 | 80.6 | |
| 5 – Most deprived | 3347 | 61 | 77.6 | 74.9 | 80.4 |
Lower super output area-based deprivation measures are assigned to patients based on their postcode of residence at the time of diagnosis and are based on the income domain of the Indices of Multiple Deprivation.1
Quintile 1 represents the most affluent quintile, and the fifth the poorest.
*Incidence is presented according to the European Standard Population
Abbreviations: IQR – interquartile range; LCI– Lower Confidence Interval; UCI – Upper Confidence Interval
Figure 1: Incidence of soft tissue sarcoma tumours by level of deprivation

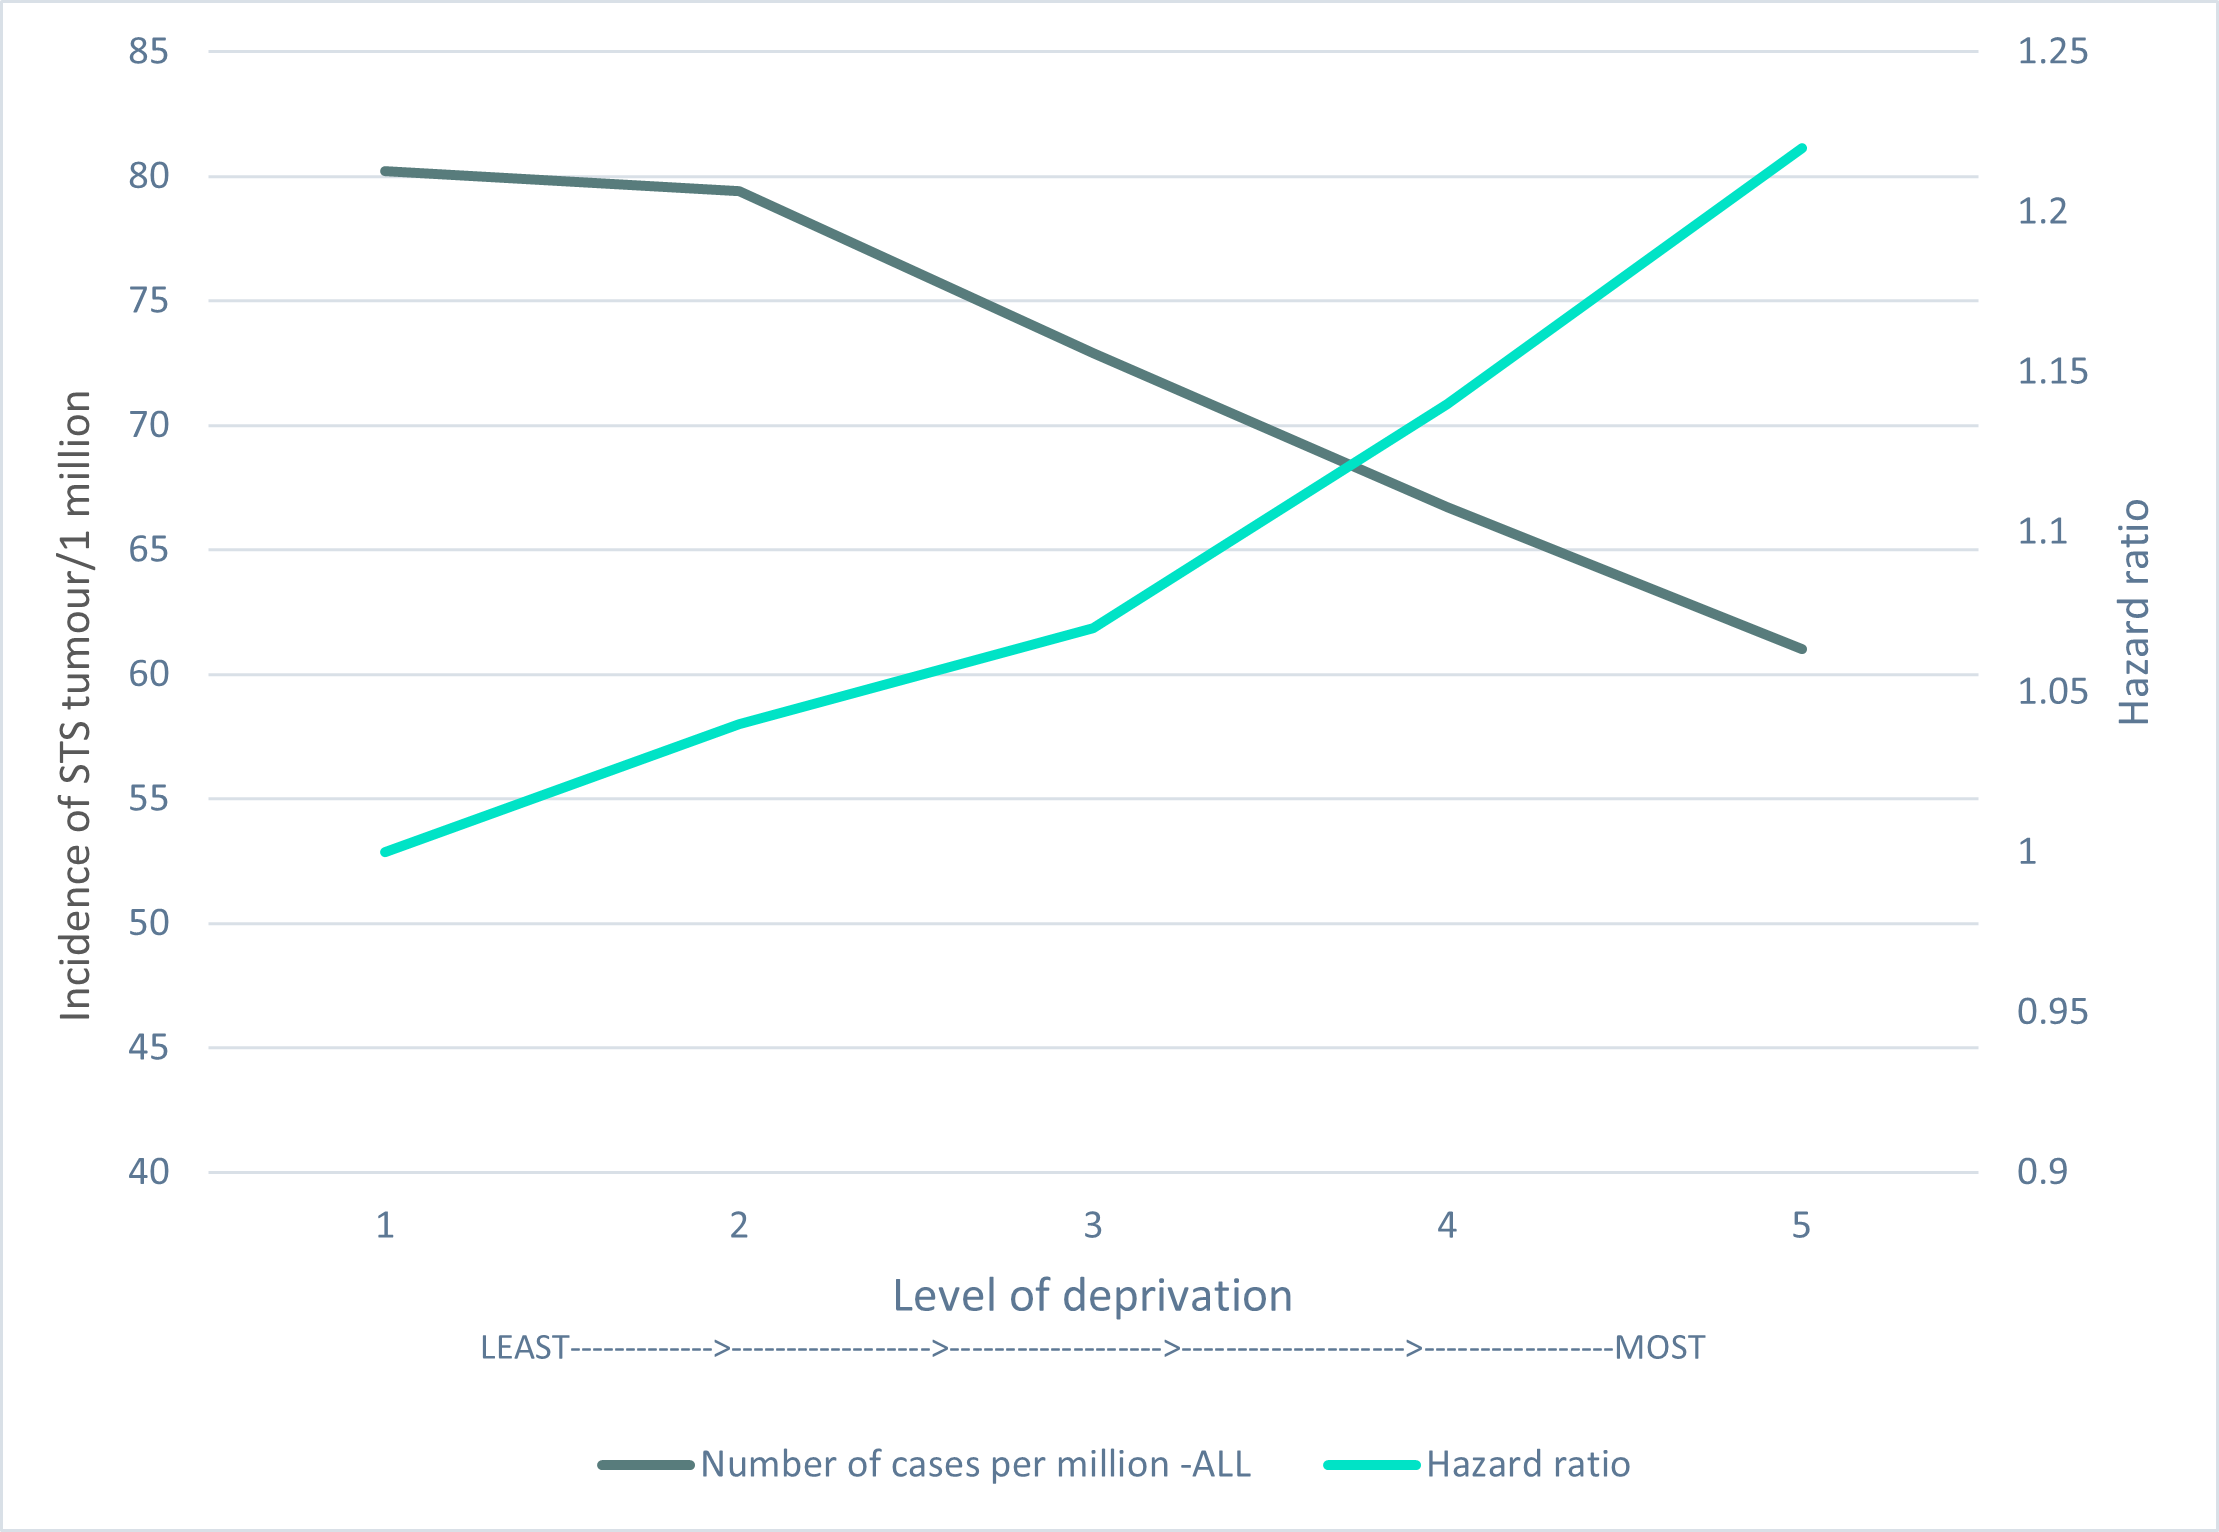
Figure 2: Incidence of soft tissue sarcoma by level of deprivation and risk of dying within five years at each level
The hazard ratio (blue line in this graph) shows the risk of dying within five years from diagnosis when compared to the least deprived group.
Patients from the most deprived group (5) are 22% more likely to die than those from the least deprived group (1).
At the same time, the number of cases per million (incidence – grey line) is higher for the least deprived group, perhaps due to higher rates of diagnosis rather than actual incidence.
References
- Venigalla, S., Nead, K.T., Sebro, R., Guttmann, D.M., Sharma, S., Simone 2nd, C.B., Levin, W.P., Wilson II, R.J., Weber, K.L. and Shabason, J.E., 2018. Association between treatment at high-volume facilities and improved overall survival in soft tissue sarcomas. International Journal of Radiation Oncology* Biology* Physics, 100(4), pp.1004-1015.
Was this information useful?
Quality assurance
We are a PIF TICK certified charity, which means our health information is produced to the highest possible standards.
Last reviewed May 2023 | Next review due May 2026
All references are available upon request. Please email info@sarcoma.org.uk


