Sarcoma is often referred to as the ‘loneliest cancer’.
With over 100 different subtypes, people often share that they never meet someone with their subtype of sarcoma.
Sarcomas make up less than 2% of all cancers diagnosed in the UK each year, but even amongst the rarest sarcoma subtypes, we are still seeing hundreds of new cases a year.
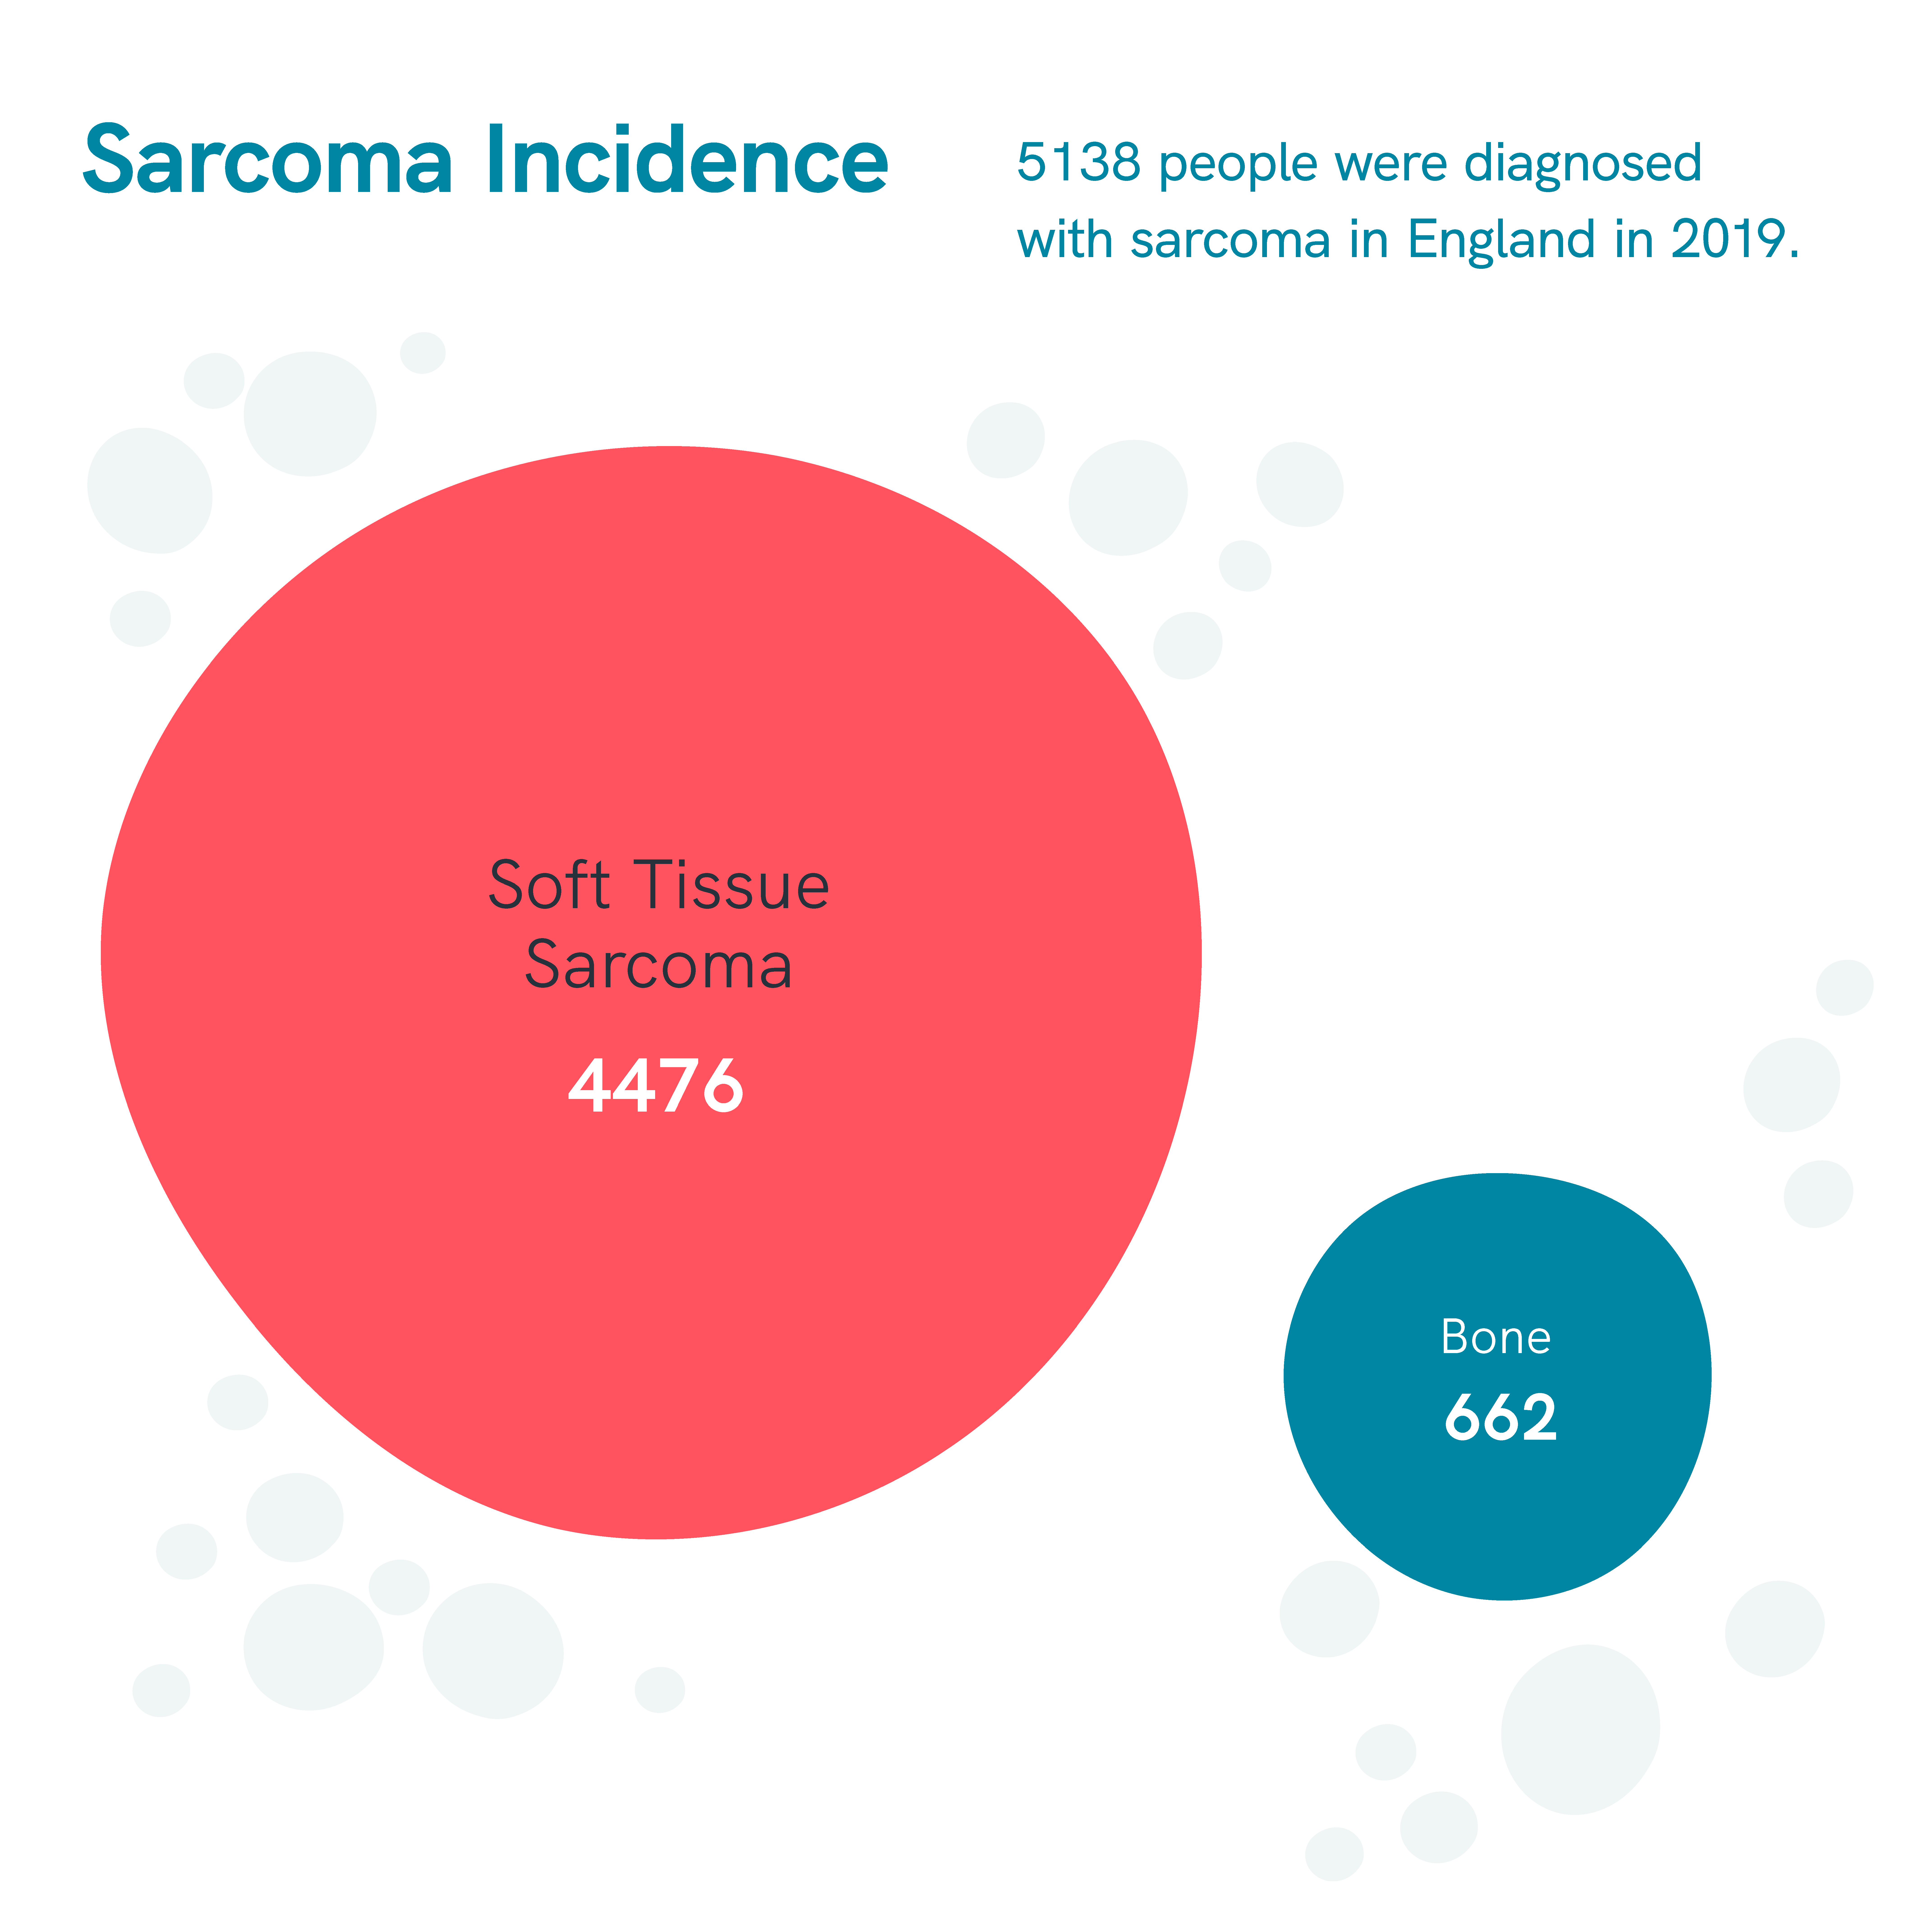
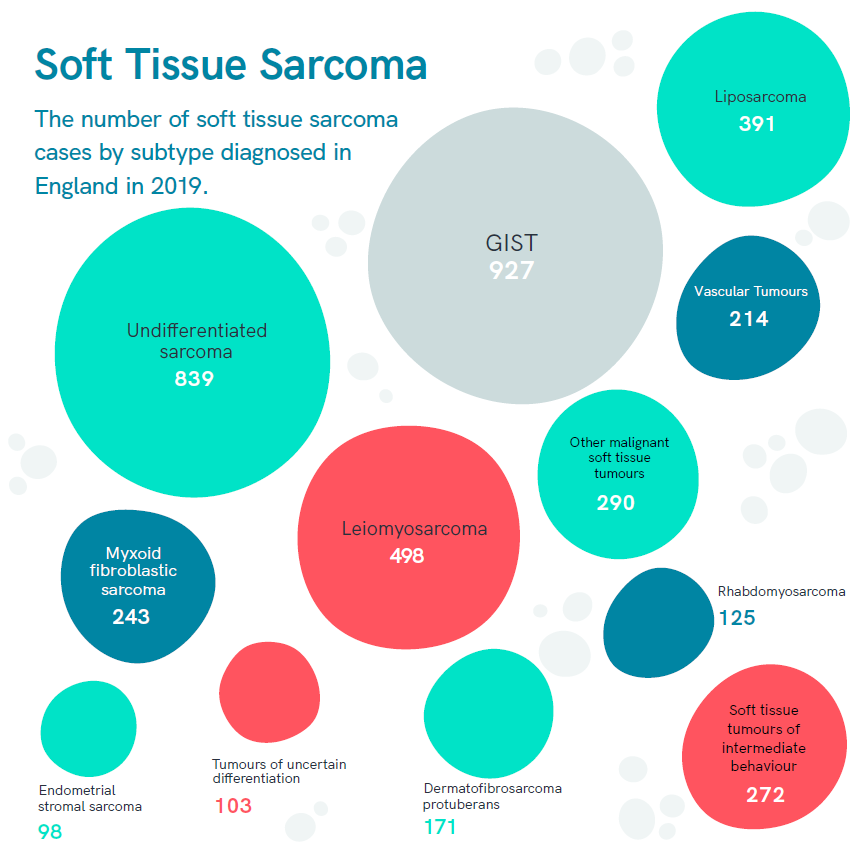
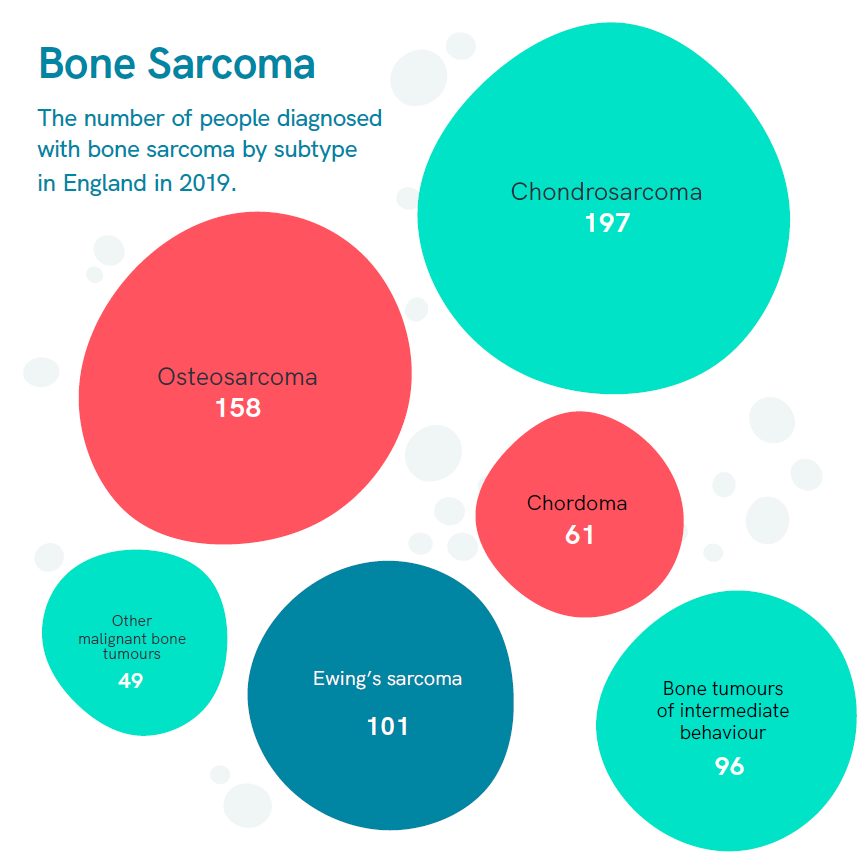
The below data is based on how many people were diagnosed with various subtypes of sarcoma in England in 2019.
We have new data on soft tissue sarcoma. Click here to explore.
Soft tissue sarcoma vs bone sarcoma
- Around 87% of sarcomas diagnosed (just under 9 in 10) are soft tissue sarcomas
- Of the 5138 diagnoses of sarcoma diagnosed in England in 2019, 4476 were soft tissue sarcomas

Soft tissue sarcomas
- The most common subtype of soft tissue sarcoma is GIST. 927 people were diagnosed in 2019, representing nearly 1 in 5 of all sarcomas diagnosed
- After GIST, the most common subtypes of sarcoma are undifferentiated sarcoma, leiomyosarcoma and liposarcoma

Bone sarcomas
- Bone sarcomas make up just 13% of all sarcomas
- 662 people were diagnosed with bone sarcoma in England in 2019
- The most common subtype of bone sarcoma is chondrosarcoma, followed by osteosarcoma

Why is the data important?
Information is collected about every cancer patient treated in the NHS, including the type of cancer, its location in the body, how it’s being treated, and each patient’s outcomes. As a less common cancer, there’s a lot we don’t know about sarcoma compared to other cancers and diseases. However, understanding how commonly it’s diagnosed and how many people are living with sarcoma is really important.
This data can provide us with a vital indication of what’s happening: who is being affected by sarcoma, and how. It can tell us which sarcoma subtypes have the poorest outcomes, help clinicians make better decisions for their patients, and ultimately, improve the standard of care across the country.
Data analyst Shane Collins shared the inside story of this process with us last year – read more here.
Why do the infographics only show data from England?
Each of the four nations of the UK collates and releases their own data, but all in slightly different ways. England provides a full breakdown of how many people were diagnosed with various subtypes. But for smaller nations, case numbers are so low it’s difficult to do this accurately, so they group their data into bone and soft tissue diagnoses.
It also takes a while for all the data to be collected and sorted – a problem exacerbated by COVID, which is why we don’t have anything more recent than 2019 for any of the four nations.
Almost 9 in 10 people diagnosed with sarcoma across the UK are from England. Scotland, Wales and Northern Ireland account for 7%, 5% and just under 2% each. You can see a full breakdown of cases across each of the four nations of the UK diagnosed here.
Why is my subtype not here?
Some especially rare subtypes of sarcoma, like clear cell sarcoma or spindle cell sarcoma, have very few people being diagnosed each year. Some of these rare subtypes are grouped together into their own categories – you can see these on the infographic (for example, ‘other malignant soft tissue tumours’).


